Memory analysis of Eternalblue
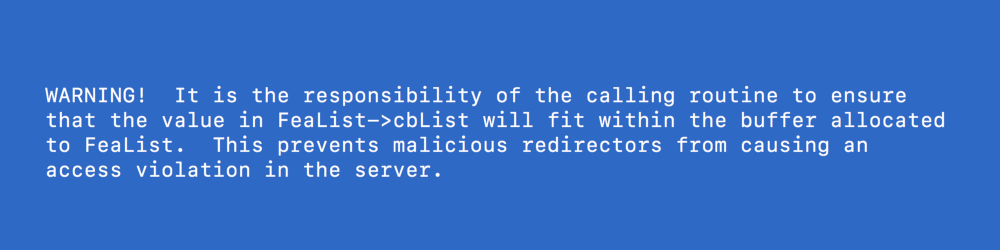 Code comment from the leaked source code of Windows NT4 which contained the vulnerability
This post is about trying to fully understand the vulnerability behind WanaCry(pt).
This post consists of the following parts.
- Understanding the exploit method
- Using the exploit and popping under the hood of a vulnerable machine to see what happens
Understanding the exploit method
The exploit methodology in this post is based on two different exploit code. One is the Metasploit plugin [1] and the other one is by a Github user @worawit [2]. Worawit’s code is very well documented and therefore it is going to be the primary source where we are going to begin. It gives us great hints about where to start this research.
The exploit
Before Microsoft patching it, SMB version 1 was vulnerable to a buffer overflow attack. The vulnerability is exploitable when a malformed Trans2 request is sent to the server which enables the attacker to overwrite another part of the memory. The goal of the attacker (and how NSA did it) would be to overwrite some useful memory portion and in this attack it is the buffer of another SMB connection which enables arbitrary write and execution of shellcode in the memory address of the Hardware abstraction layer (HAL). [1][3]. In all Windows versions before the Windows 10, the HAL is in a fixed memory address and is used during boot, therefore making it a nice target for the shellcode.
The exploit is happening in non-paged pool memory which the SMB server allocates for the large requests sent to it. This is quite important information as we will soon see.
From the Metasploit and Worawits exploit, we can see that the primary exploit method works by creating multiple SMB connections which makes the server reserve lots of space for the connections. This helps with aligning the data so that the malicious packet is in a correct position to overflow to the next SMB connection. This process where filling up the heap so that the malicious content would go to a advantageous position is called heap grooming.
Finding the connections
I launched a Windows 7 SP1 virtual machine for testing this exploit. This is useful because it is easy to take a memory dump of the whole machine. After setting up my environment I took a memorydump in the middle of the exploit.
I am using Volatility to explore the memory dumps and trying to find the data that reside in the non-paged pool. All in all I am using four primary memory dumps to explore the exploit code of the Metasploit plugin.
- After the first “large buffer” packet is sent (line 186 [1])
# Step 2: Create a large SMB1 buffer
print_status("Sending all but last fragment of exploit packet")
smb1_large_buffer(client, tree, sock)
- After the first grooming packets are sent
# Step 3: Groom the pool with payload packets, and open/close SMB1 packets
print_status("Starting non-paged pool grooming")
# initialize_groom_threads(ip, port, payload, grooms)
fhs_sock = smb1_free_hole(true)
@groom_socks = []
print_good("Sending SMBv2 buffers")
smb2_grooms(grooms, payload_hdr_pkt)
- After the second grooming packets are sent
- After the malformed Trans2 packet is sent
Using Volatility
Volatility includes a plugin called bigpagepools which we will be using here since we know the exploit is happening in big pools. We would like to look for the buffers that the server reserves in the memory in order to better understand how the grooming process works. By trial and error I found that the buffer has a tag LSbf and I am using it to filter the results in volatility.
markus$./volatility_2.6_lin64_standalone --profile=Win7SP1x64 -f /home/markus/2.dump bigpools --tags=LSbf
Volatility Foundation Volatility Framework 2.6
Allocation         Tag      PoolType                   NumberOfBytes
------------------ -------- -------------------------- -------------
0xfffffa8001ad8000 LSbf     NonPagedPool               0x11000L
0xfffffa8001ac7000 LSbf     NonPagedPool               0x11000L
0xfffffa8001afa000 LSbf     NonPagedPool               0x11000L
0xfffffa8001ae9000 LSbf     NonPagedPool               0x11000L
0xfffffa8001a61000 LSbf     NonPagedPool               0x11000L
0xfffffa8001964000 LSbf     NonPagedPool               0x2000L
0xfffffa8001a50000 LSbf     NonPagedPool               0x11000L
0xfffffa8001a72000 LSbf     NonPagedPool               0x11000L
0xfffffa8001a94000 LSbf     NonPagedPool               0x11000L
0xfffffa8001a83000 LSbf     NonPagedPool               0x11000L
0xfffffa8001ab6000 LSbf     NonPagedPool               0x11000L
0xfffffa8001aa5000 LSbf     NonPagedPool               0x11000L
0xfffffa8001a3f000 LSbf     NonPagedPool               0x11000L
I verified wheter these are in fact the right pages by running the same command with the other memory dumps and the results are consistent with the code. For example, here is the results for memory dump number 1.
markus$./volatility_2.6_lin64_standalone --profile=Win7SP1x64 -f /home/markus/old/3 bigpools --tags=LSbf
Volatility Foundation Volatility Framework 2.6
Allocation         Tag      PoolType                   NumberOfBytes
------------------ -------- -------------------------- -------------
0xfffffa8001964000 LSbf     NonPagedPool               0x2000L
As you can see, the first big buffer is the only one allocated as it should be.
Visualizing the data
I wrote a small Python program that uses the Volatility framework to visualize the memory segments. You can find the full code in my github here. The code generates following pictures (click to open the original file):
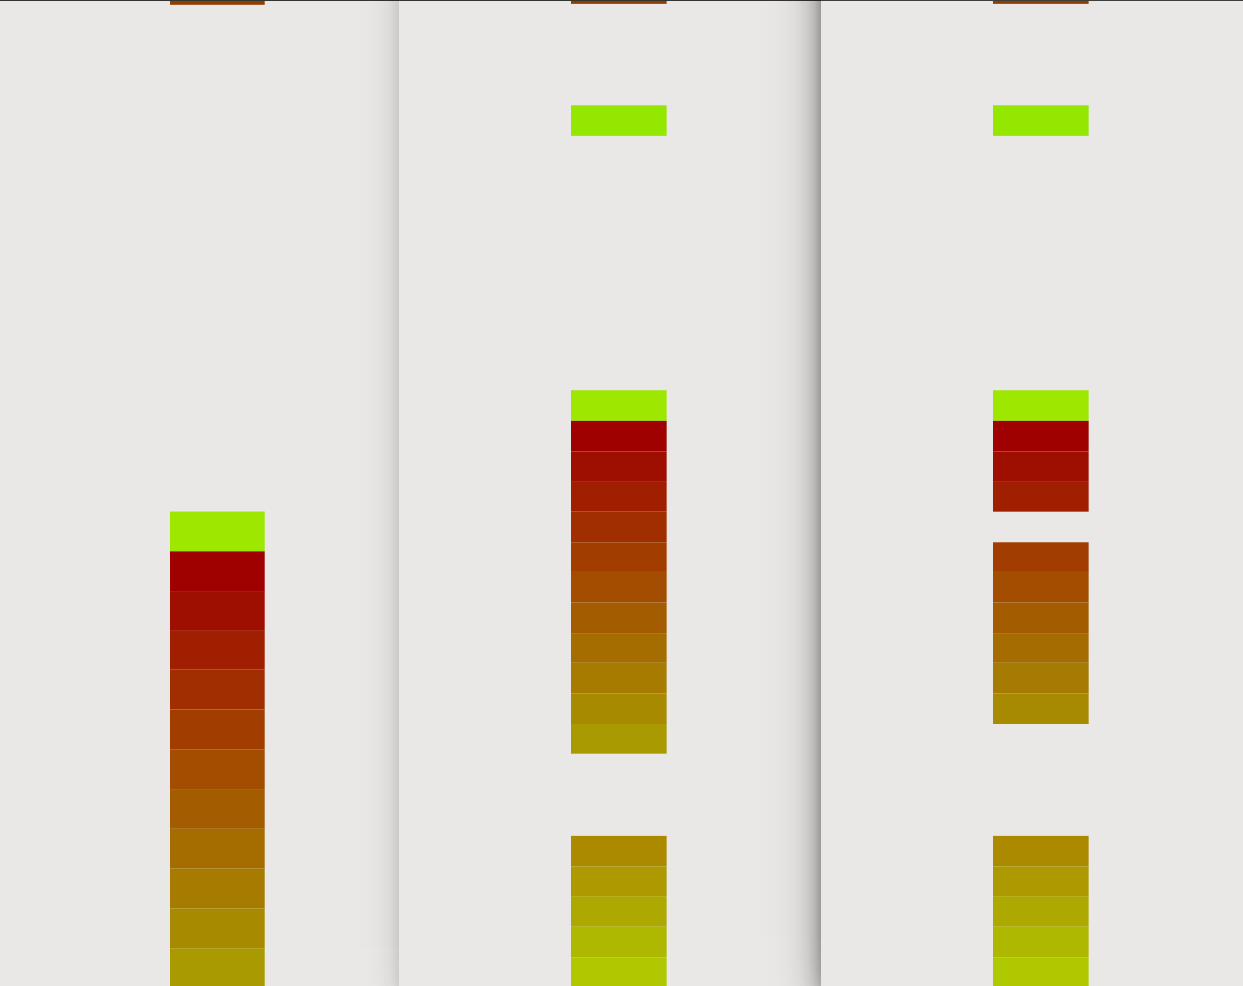
Figure 1: Before the exploit (step 3)
 Figure 2: After the exploit (step 4)

This might require some explanation…
In both figures a single vertical line represents the memory contents of a single buffer that is allocated by the SMB server for an incoming connection. The lines are in order by their virtual address, but the figure does not show the appropriate space between the buffers (see figure 3). One pixel in the figures represents three bytes of memory content converted to RGB hexadecimal value.
If you look closely, you can see the first line is a bit different from the others. That is the smaller initial packet sent at step 1 and it apparently has a different kind of structure.
I also extended the Python script to visualize the buffers and where they are in the memory. The following figure pictures the state of the memory during different parts in the exploit. This time, the content is not part of the visualization. The colors are hashes of the starting addresses of the buffers which helps with distinguishing different buffers and their locations.
Figure 3: Buffers visualized in the addresspace. After first grooming (left), after the second grooming (middle), after the exploit has finished (right)
Analysis
SMB buffers contain a struct header which contain some pointers and details about the connection. This is the part that the exploit eventually overwrites and enables the whole exploit. The data that is overflown contains a fake struct for a SMB connection that is overwritten by the overflow. I will go into more details about the struct and the overflow in part 2, but right now, what you need to know is that there exists a header in the buffer before the actual content. The header is clearly visible in figure 1 since the beginning of the buffers have a similar content and therefore colors.
In the code, after step 4, the connections are terminated. Figure 2 pictures the memory content of the buffers after these connections are terminated and the exploit is finished. As you can see, there are few connections (two to be exact) that have been successfully terminated and the memory area cleared. The third connection has successfully executed the exploit and therefore the rest of the connections are still lingering in the buffer. The successful buffer overflow is visible in around the middle where the buffer memory starts as normal, but ends in garbage overwriting the rest of the few buffers as well.
Wrap-up
In this post, I looked at the vulnerability in the SMB version 1 from a memory forensics point of view. In the next post, I hope to find out more about how the vulnerability really works. Where does the heart of the vulnerability lie? I will head further into reverse engineering the code that contains the vulnerability.
Sources
[1] https://github.com/rapid7/metasploit-framework/blob/master/modules/exploits/windows/smb/ms17_010_eternalblue.rb
[2] https://gist.github.com/worawit/bd04bad3cd231474763b873df081c09a
[3] https://www.fireeye.com/blog/threat-research/2017/05/smb-exploited-wannacry-use-of-eternalblue.html